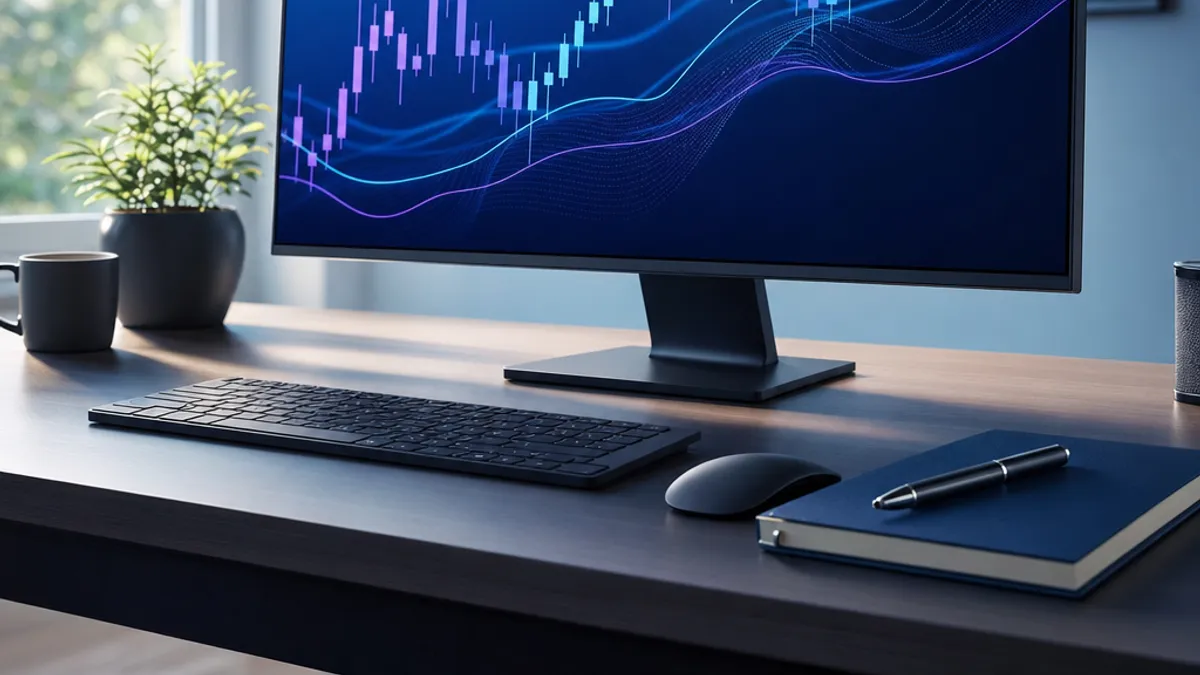
How volatile were the indices today and how to read it
How volatile were the indices today? Here is how to answer that from the screen in front of you, using tick ranges, digit spread and what the signals show.
How volatile were the indices today is a question with a real answer, and you can get it from your own screen in about two minutes. You do not need a news feed or a market report. Deriv's synthetic indices carry their volatility in the name, and the rest of the answer comes from the tick chart, the digit spread and the signal cards in front of you. This post explains how to read those three things and what each one actually tells you.
Trading these markets loses money for a lot of people. Reading the day correctly does not change that. It changes how carefully you size what you do next.
The name of the index already tells you half the answer
Volatility 10, 25, 50, 75 and 100 are built to move at different speeds, and the number is the label for that. Volatility 10 is the quiet end. Volatility 100 is the loud end. If you are asking how volatile the indices were today and you spent the session on Volatility 10, the honest answer is probably "less than Volatility 100 was, as usual".
The one second versions sit alongside them. They produce ticks faster, so a chart of the same length covers less clock time and more price action. A trader who switches from the standard version to the one second version and keeps the same contract duration has changed the trade, even though nothing on the ticket looks different.
So the first step in answering the question is to name the market precisely. Not "the indices". Volatility 75, standard or one second, over the window you actually traded.
The tick chart gives you the day's range, not a feeling about it
The quickest honest measure of a session is how far price travelled against how far it ended up. Open the chart for the index, look at the high and the low for the window, and compare that to where price closed the window. A wide range with a flat finish is a day that chopped. A narrow range with a clean finish is a day that trended quietly. Both of those are volatility answers, and they point at different problems.
A tick chart shows every price update, so it is the one to use when you are judging whether the market was jumpy. A candlestick chart groups ticks into time blocks, which smooths over exactly the behaviour you are trying to see. If you want to put Deriv markets on a chart you already know how to read, TradingView charts with Deriv covers that setup.
Write the range down somewhere. A single day's range means almost nothing on its own. Five days of ranges for the same index is a reference you can actually use.
Digit spread is a different reading of the same day
On the digit contracts, volatility shows up as the shape of the last digit distribution rather than as price range. The digit analyzer reads the last digits of the synthetic indices and lays out the cards behind its pick for the next tick: how often each digit has appeared over the window, how long since each one last showed, and the even and odd split.
A day where the distribution stays close to flat is a different kind of day from one where two or three digits have run well ahead of the rest. Neither shape is a forecast. The spread is a description of what has happened in the window you selected, and it changes when you change the window. Widen the sample and a skew that looked dramatic often flattens out.
That is the useful discipline. Check the same reading at two window lengths before you treat it as a feature of the day rather than a feature of your settings.
What the signals show when the market is moving fast
The AI Signals screen gives one call per market and shows the reasoning that produced it. On a fast day, the thing worth watching is not the direction of the call. It is how quickly the reasoning changes underneath it. A read that holds across several refreshes describes a market with some structure in it. A read that flips repeatedly is telling you the structure is not there right now.
The signal is an input, not an instruction. You decide whether to act on it, and the answer on a choppy session is often that you do not.
Volatility is the reason the limits exist
The faster the index moves, the less the plan in your head is worth and the more the limits in the software matter. Auto Trader places trades from the signals and stops when it hits the limits you set, including a loss limit and a target. Those numbers are the whole point of letting software trade. A loss limit decided before the session is a different decision from one made while you are down.
The same applies to anything you run out of the bot builder. A bot does not notice that today is faster than yesterday unless you built that in. It runs its blocks at whatever speed the market gives it, which is exactly why a bot that behaved well on Volatility 25 can behave very differently on Volatility 100 with nothing else changed.
Test on a demo account when conditions change. Demo and real accounts both work through the same Deriv sign in, and the demo one costs you nothing to be wrong on.
How to answer the question for yourself tomorrow
A short routine covers it:
- Name the exact index and the exact window.
- Read the high, the low and the close for that window on a tick chart.
- Check the digit spread at two different sample lengths.
- Refresh the signal a few times and watch whether the reasoning holds.
- Set the loss limit and the target before anything runs.
None of that predicts the next tick. It tells you what kind of day you are in, which is the part most people skip.
Open the analyzer guide and run the digit reading on one index on a demo account before you use it on a real one.
Questions
Which Deriv synthetic index moves the most?
The number in the name is the guide. Volatility 100 is built to move more than Volatility 10, with 25, 50 and 75 in between. The one second versions of each produce ticks faster, so the same chart length covers less clock time.
Does a volatile day make digit contracts easier to read?
No. A fast day changes the shape of the last digit distribution, but the analyzer is describing the window you selected, not forecasting the next tick. A skew that looks strong on a short sample often flattens when you widen the window, which is why it is worth checking two lengths.
Should I turn a bot off on a volatile day?
That is your call, and it depends on what the bot was built to do. A bot runs its blocks at whatever speed the market gives it and will not notice that today is faster than yesterday. If you are unsure, run it on a demo account first and watch how it behaves before putting real money behind it.
Can BancaBot take money out of my Deriv account?
No. You sign in through Deriv's own OAuth screen and the permission asked for is trading only, which lets BancaBot read the balance and place trades. It cannot withdraw, cannot move money and never sees your password.
Trading on Deriv puts your money at risk, and automation does not change that. Practise on a demo account first and only trade money you can afford to lose.
Try this on your own account
Every tool in this post is free on a Deriv demo account. Log in with Deriv and nothing else is needed.